Investing · Deep dive
The Private Equity & Private Credit Debt Crisis: A Complete Data Guide
Private equity and private credit have quietly become a $9.4 trillion shadow financial system — one where the managers who profit from the assets are the same people who decide what they're worth. This is the complete, sourced walk-through of how the bubble was built, where the cracks are showing, and who ends up holding the loss.
- PE + private credit control ~$9.4T across ~12,500 companies and ~11M workers.
- The reported ~2.0% default rate hides a 6.4% shadow default rate (Lincoln International, Q4 2025).
- $718B of US pension money is in PE; Oregon PERS leads at 26.9%, Norway holds 0%.
- A $1.54T affiliated-reinsurance hole sits against just $657B of life-insurer surplus.
- Re-marking the largest interval fund (CCLFX) suggests ~78¢ on the dollar vs. the 100¢ reported.
1. The scale of the bubble
Private equity and private credit together control roughly $9.4 trillion in assets, across about 12,500 companies employing around 11 million workers. What began as a niche asset class is now a parallel financial system larger than most people realize — there are more PE-backed companies in America than McDonald's locations.
Private credit alone deployed $593 billion in 2024, a 78% year-over-year increase. Its AUM hit $3.5 trillion in 2025 — nearly doubling from $2 trillion in two years — with Morgan Stanley projecting $5 trillion by 2029. The money machine has never been bigger. The open question is whether the assets behind it are real.
2. The incentives: paid to deploy, not to be right
The PE business model rewards deployment, not performance. Firms collect a 2% management fee on committed capital regardless of returns — nearly $188 billion per year on $9.4 trillion, before a single dollar is returned to investors. Carried interest adds 20% of profits on top.
"These are not investors. They are dealmakers."— attributed in the source material
Add-on deals now represent 76% of all PE-backed buyouts: buying small companies at 5–8x earnings and bolting them onto platforms valued at 12–15x. The "value creation" is largely paper arbitrage. Build the model, get the deal done, book the fee.
3. The marks & the PIK death spiral
The headline default rate of about 2.0% (KBRA, Q4 2025) is contested. Counting distressed exchanges, PIK conversions, and amend-to-extend deals that never appear in official numbers, Lincoln International put the shadow default rate at 6.4% in Q4 2025 — more than 3x the reported figure. In 2024, distressed exchanges ran 5x conventional defaults.
How the PIK death spiral works
- A borrower can't pay cash interest, so the lender agrees to PIK (Payment-In-Kind) — interest added to principal.
- The BDC reports the PIK as "income," even though no cash was received.
- The BDC pays cash dividends on that phantom income (it must distribute 90% of taxable income).
- If the borrower defaults, the income was never real — but the dividends were already paid out.
- The result is a slow bleed of capital disguised as income generation.
The EBITDA add-back scam
Sponsors inflate EBITDA to make leverage look manageable. S&P's studies of hundreds of deals found that 47% of LBO EBITDA is add-backs (2020–2025), 54% of deals miss projections by 25%+ (S&P, 2023), and real leverage runs about 3.3 turns higher than marketed by Year 2. Common tactics: phantom synergies, recurring "one-time" costs, the related-party REIT rent trick, and pro-forma adjustments for locations still under construction. Reported leverage of 6x is often 8–10x in reality.
Sources: S&P Global Ratings EBITDA Add-back Studies (2020–2025); Bloomberg (Feb 2025); PitchBook (2026); Moody's (2014).
4. The liquidation gap
"What is the liquidation value of a car wash? Hoses and soap."
"Senior secured" means little when the collateral is leased property with bolted-in equipment. Recovery on enterprise value collapses for asset-light roll-ups: car wash 10–25¢, software 15–35¢, dental 20–40¢. First-lien recovery rates overall fell from 76% in 2022 to 39% in 2024. Covenant-lite deals jumped from 4% to 21% in two years, and 50% of mega-deals over $500M lack financial maintenance covenants entirely.
| Metric | Sponsor case | Stressed | Real distress |
|---|---|---|---|
| EBITDA | $50M | $35M | $25M |
| Multiple | 9.0x | 5.4x | 3.6x |
| Enterprise value | $450M | $189M | $90M |
| Equity value | $175M | $0 | $0 |
| Lender recovery | — | 68.7% | 32.7% |
Try the interactive stress-test calculator →
5. The hand-off cycle ("Live Grenade")
Companies get passed from one PE owner to the next, each time with more debt, until the music stops. Across 57 tracked companies the average is 2.8 ownership changes, with 21 ending in bankruptcy. Mister Car Wash traced from Onex ($52M equity) → Leonard Green ($520M) → IPO at $15 → peak $23.53 → going private at $7 — a 53% drop from IPO, 70% from peak, with Leonard Green owning 67% throughout.
The newest twist: GP-led continuation vehicles hit $115 billion in 2025 (up from $75B in 2024) — a GP selling a company from one fund to another fund it also manages, generating new fees and carry on the same asset.
| Company | Owners | Outcome |
|---|---|---|
| Energy Future (TXU) | KKR + TPG + Goldman | Largest PE bankruptcy ever (~$45B) |
| Toys R Us | KKR + Bain + Vornado | Liquidated 2018 (~$5B) |
| Caesars (Harrah's) | Apollo + TPG | Bankruptcy 2015 (~$30.7B) |
| Red Lobster | Golden Gate → Thai Union | Bankrupt 2024 (sale-leaseback) |
| Steward Health Care | Cerberus | Bankrupt 2024 ($9B+) |
See all Live Grenade timelines →
6. The insurance trick
Roughly $1.1 trillion sits offshore with no mark-to-market. The play, step by step: acquire an insurer for permanent capital; redirect assets from bonds into PE-originated private credit, CLOs, and ABS; report at amortized cost under statutory accounting; cede liabilities to a Bermuda affiliate; secure favorable private letter ratings; and harvest the spread between the annuitant promise (3–5%) and PC yield (8–12%). Failure cases already include PHL Variable (Golden Gate, $2.2B deficit, pursuing liquidation) and 777 Partners / 777 Re ($500M fraud, three insurers insolvent, co-founder indicted).
7. The pension exposure
$718 billion of retiree money is in private equity. Oregon PERS is the worst case at 26.9% — nearly 2x the national average — with $3.7B lost to overallocation and PE returning 4.1% vs the Russell 3000's 38.4% over a comparison period. University endowments run higher still. Norway's ~$2.1T sovereign fund, by contrast, holds zero PE.
| Allocator | PE % | AUM |
|---|---|---|
| Yale Endowment | 50% | $20.7B |
| Harvard (HMC) | 41% | $21.3B |
| Oregon PERS | 26.9% | $26B |
| CalPERS | 17.7% | $98B |
| CalSTRS | 15.7% | $55B |
| Norway sovereign fund | 0% | ~$2.1T |
Explore the full pension map →
8. The cracks appearing now
"We are in the super-early innings of the wheels coming off the car."— Boaz Weinstein, Saba Capital, February 2026
Blue Owl fell 65% from its high and permanently halted OBDC II redemptions ($1.6B in liquidation). Morgan Stanley's North Haven was hit with 10.9% redemption requests and enforced a 5% cap. A record $25B of software loans trade below 80 cents. PE was behind 54% of the 35 largest US bankruptcies in 2025. BCRED saw $3.7B redeemed in Jan–Feb 2026. Meanwhile Fitch put the BDC default rate at 5.8% (Feb 2026), Moody's cited 7.5%, and Marathon warned software defaults could hit 15%.
9. The bank fee machine
Banks earn nearly 4x the return lending to private credit funds: a 29.2% return on equity versus 7.9% for traditional commercial lending. The fee chain: a PE firm does the LBO → the bank earns $3.5–8M per $100M arranging debt → the bank warehouses the loans → packages them into a CLO (1–2% structuring fee) → a PE-owned insurer buys the "AAA" tranche at amortized cost → and annuity holders, pension beneficiaries, and retail investors bear the risk. NDFI lending has passed $1.32 trillion, quadrupling since 2016. Norinchukin — the world's largest single CLO investor at $54B — lost $9.3B in FY2024 on CLO markdowns.
10. The RIA retail pipeline
Private equity has acquired roughly 42% of all RIA assets — owning the advisors, manufacturing the products, controlling the platforms, and now moving toward 401(k)s. The pipeline: a PE firm manufactures the fund, a gatekeeper (iCapital, CAIS) wraps it, a PE-backed RIA places it in client portfolios, and quarterly redemption gates lock the money in. A $1M portfolio with 20% alternatives can carry five fee layers totaling ~1.69% of the whole portfolio — roughly $169,000 over ten years — while the client sees "1%" on the statement.
11. The $1.54 trillion insurance hole
"$1.54 trillion against 650 billion in total surplus. If even half of this is not good, it breaks everybody. And this is just the affiliated."— Tom Gober, forensic accountant
Using NAIC/SNL data for year-end 2025, forensic accountant Thomas Gober calculated total affiliated reinsurance across all 714 licensed US life & annuity carriers at $1.54 trillion — 235% of the industry's $657 billion in surplus. Strip the affiliated-reinsurance credit from each balance sheet and 29 of the top 30 insurers are insolvent without it; the only survivor is MassMutual, a mutual with no PE overlay.
| Entity | Affil. reins. | Surplus | Ratio |
|---|---|---|---|
| Athene (Apollo) | $235.7B | $4.1B | 5,719% |
| RGA Reinsurance | $72.7B | $3.0B | 2,432% |
| Hannover Life Re | $56.9B | $0.6B | 9,857% |
| Commonwealth Annuity (KKR) | $47.2B | $6.9B | 687% |
| Amer. Equity Life (Brookfield) | $35.6B | $2.8B | 1,288% |
Read the full insurance investigation →
12. Loan-book forensics: CCLFX
Everything above is macro. So I opened the hood on one fund: CCLFX, the Cliffwater Corporate Lending Fund — the largest interval fund in private credit at ~$49.8B gross assets, marketed to retail as "senior secured lending," with 97% Level 3 assets. Parsing 2,330 positions from its SEC N-PORT filing and re-marking each against secondary-market rates and free-cash-flow analysis produces a three-way gap:
| Measure | Cliffwater | Market | FCF mark |
|---|---|---|---|
| Per dollar | 100¢ | 89¢ | 78¢ |
| Gross assets | $49.8B | $46.2B | $42.8B |
| Implied NAV | $31.5B | $27.9B | $24.5B |
The estimate is a ~$7.1B overstatement (14% of assets, 22% of NAV). Red flags include 189 PIK entries by late 2025 (from zero in 2021), 473 maturity extensions, $5B+ of first-loss CLO equity marked at par despite no secondary market, and self-dealing into captive vehicles. This is a question about mark accuracy given 97% Level 3 assets and no independent pricing — not an allegation of fraud.
Read the full CCLFX forensics →
13. Where we are in the bubble
Mapped to classic bubble mechanics: Innovation (2009–2015, genuine value) → Boom (2016–2019, fundraising surges) → Euphoria (2020–2022, "safer than IG bonds") → Denial (2023–2025, exits collapse, PIK surges) → Panic Begins (2025–2026) — you are here: Blue Owl −65%, redemption gates, BCRED outflows of $3.7B in eight weeks, Moody's default rate 7.5%, Marathon warning 15%. The music is stopping.
Frequently asked questions
How big is the private equity and private credit bubble?
PE and PC together control roughly $9.4 trillion across about 12,500 companies and 11 million workers. Private credit AUM alone reached $3.5 trillion in 2025, projected to $5 trillion by 2029.
What is the shadow default rate?
Reported ~2.0% (KBRA, Q4 2025); the real rate including distressed exchanges, PIK conversions, and amend-to-extend deals is 6.4% (Lincoln International, Q4 2025) — more than 3x higher.
How much pension money is exposed to PE?
About $718 billion. Oregon PERS leads at 26.9%; Yale's endowment is 50%. Norway's sovereign fund holds zero.
What is a PIK death spiral?
A borrower that can't pay cash interest adds it to principal (PIK). A BDC books that as "income" and pays cash dividends on it; if the borrower defaults, the income was never real but the dividends were already paid.
What is the $1.54 trillion insurance hole?
Total affiliated reinsurance across 714 US life and annuity carriers is $1.54 trillion (Gober/NAIC, YE 2025) — 235% of the industry's $657 billion surplus. Strip the credit and 29 of the top 30 insurers are insolvent.
Is this investment advice?
No. This is an investigative data guide compiled from SEC filings, pension fund reports, NAIC statements, and public records.
Explore the full interactive project — maps, calculators, and sortable databases — at carsonscorner.media/debtcrisis. Questions, corrections, or data tips: [email protected].
Selling, buying, or raising capital? Let's talk.
Brokerage, equity participation, and capital partnerships for commercial real estate owners, investors, and family offices — nationwide, through the eXp Commercial platform.
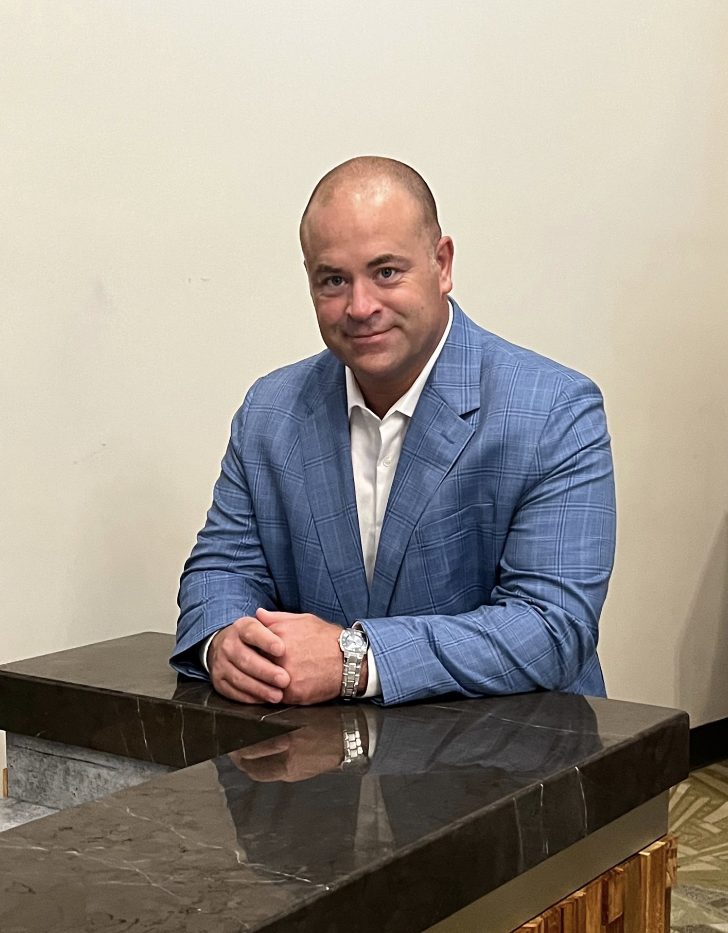
Carson Jones
Carson Jones is the host of Carson's Corner: Commercial Real Estate, author of The Red Flag Playbook, a licensed commercial real estate advisor and business broker, and the founder of Passive Investments. With 18 years of experience as an entrepreneur and 12 years specializing in passive investing, Carson works with high-net-worth individuals, family offices, business owners, and sophisticated investors as a broker, principal, and capital partner.
Carson holds a BBA in Finance from Baylor University and his Tennessee commercial real estate license (#382989). He actively pursues acquisition and equity opportunities across the United States through a nationwide network of qualified buyers, family offices, institutional investors, and top-tier developers.